QQQ Technical Analysis for 2025
Introduction
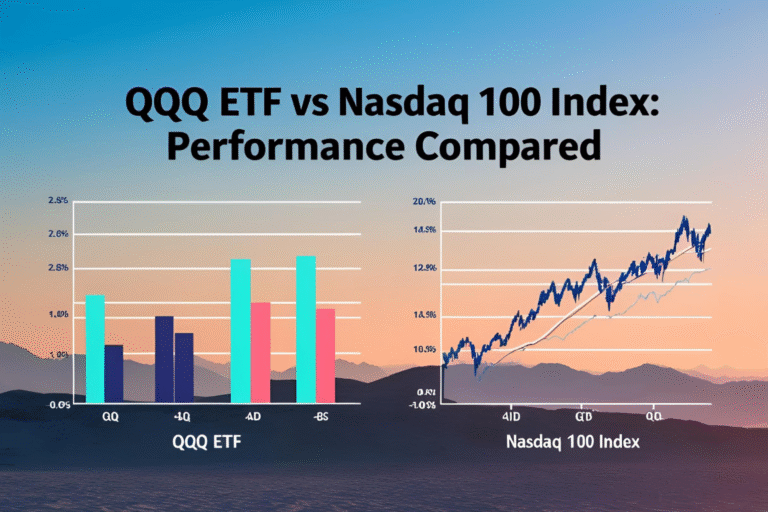
With QQQ reaching new highs and leading the tech rally, understanding the technical analysis for 2025 can help investors make smarter entry and exit decisions. This post explores current trend lines, momentum indicators, and key support/resistance zones to watch for the year ahead.
Current Trend Overview (as of Q2 2025)
- Price Range: ~$420–$435
- Trend Direction: Bullish
- Volatility: Moderate to high, driven by earnings and macro data
- Volume: Strong institutional interest, especially in AI-related tech stocks
Key Support and Resistance Levels
| Level Type | Price Range |
|---|---|
| Immediate Support | $410 |
| Major Support | $390 |
| Immediate Resistance | $440 |
| Breakout Zone | $455+ |
A break above $440 with volume confirmation could signal a fresh bullish breakout.
Moving Averages (Daily Chart)
- 50-Day MA: $415
- 100-Day MA: $402
- 200-Day MA: $388
QQQ is currently above all key moving averages, indicating strong upward momentum.
RSI (Relative Strength Index)
- Current RSI (Daily): 65–70
- Interpretation: Approaching overbought territory. Traders may watch for pullbacks near resistance.
MACD (Moving Average Convergence Divergence)
- MACD Line > Signal Line
- Histogram: Positive
- Trend: Bullish with increasing momentum
MACD indicates strength, but traders should monitor for any divergence if price stalls.
Bollinger Bands
- QQQ is currently trading near the upper band, suggesting potential short-term resistance.
- Watch for mean reversion toward the middle band (~$420) if volume weakens.
Fibonacci Retracement Zones (from 2022 low to 2024 high)
- 38.2% level: ~$385
- 50% level: ~$370
- 61.8% level: ~$355
These zones are important for long-term dip-buying strategies if broader correction happens.
Technical Outlook for 2025
- Short-Term: May consolidate around $430–$440 before a breakout attempt
- Mid-Term: Bullish bias supported by trend indicators and earnings momentum
- Risk Trigger: A breakdown below $390 may signal a trend reversal or extended correction
Trading Tips
- Use limit orders near support levels rather than chasing price spikes
- Combine RSI + MACD for confirmation
- Watch for volume spikes during key breakouts
Final Thoughts
The QQQ technical analysis for 2025 remains positive, supported by strong trends, moving average alignment, and bullish momentum. However, with the RSI nearing overbought levels, short-term volatility is possible. Active investors should monitor resistance zones closely and adjust positions accordingly.
FAQs
Is QQQ in a bullish trend in 2025?
Yes, it remains above key moving averages with a strong MACD signal.
What is the major resistance level for QQQ now?
Around $440, followed by $455 as the next breakout level.
What does RSI near 70 mean for QQQ?
It may indicate overbought conditions, suggesting a possible short-term pullback.
Should I buy QQQ at current levels?
If you’re long-term focused, buying dips near support levels may offer better risk-reward.
What’s the risk level for QQQ in 2025?
Moderate. Watch for macroeconomic risks and tech-sector earnings surprises.