Historical QQQ Price Performance (10-Year Chart)
Introduction
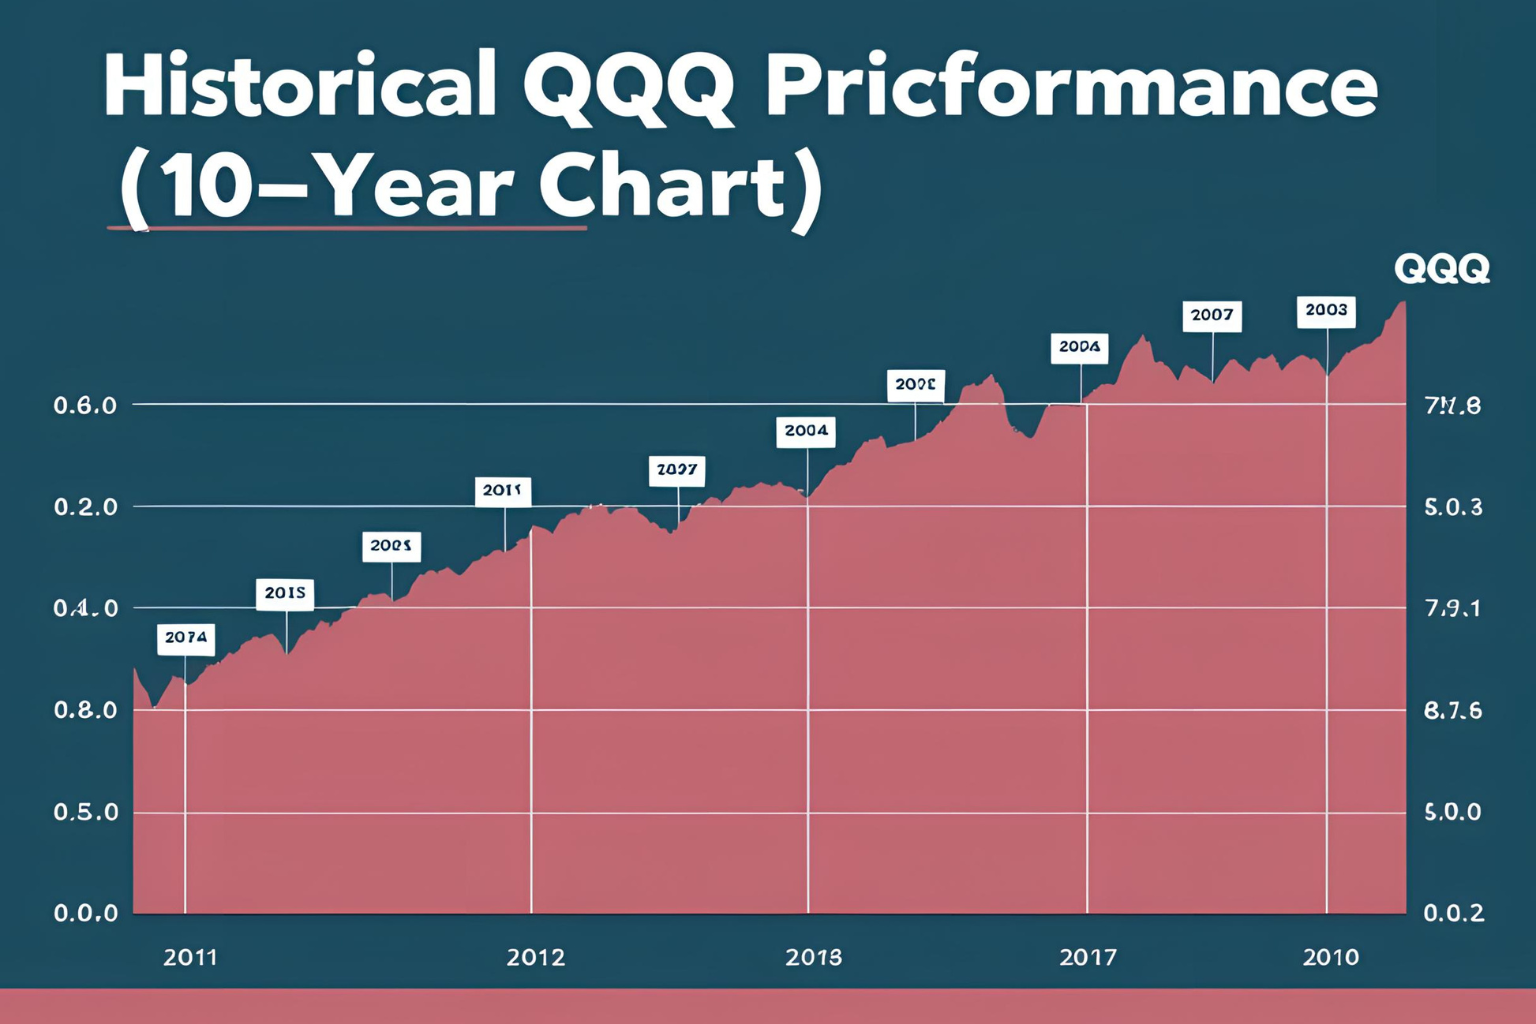
Before investing in any ETF, it’s crucial to understand how it has performed over time. The historical QQQ price performance tells a powerful story of long-term growth, particularly in the technology sector. In this post, we’ll analyze QQQ’s price movements over the last 10 years and what investors can learn from its chart trends.
Quick Overview: 10-Year Snapshot (2015–2025)
- 2015 Price: ~$105
- 2020 Price (Pandemic dip): ~$165 → Recovered to ~$300 by year-end
- 2022 High: ~$400+
- 2023 Correction: Dropped to ~$280 range
- 2025 (current): Hovering around ~$430+
Note: All values are approximations and depend on market data.
Key Drivers of QQQ Growth
QQQ tracks the Nasdaq-100 Index, which is driven by top-performing tech and innovation-heavy companies. Over the last decade, growth was fueled by:
- Tech Dominance: Apple, Microsoft, Nvidia, and Amazon surged in valuation
- Cloud and AI Boom
- Strong Earnings Growth
- Digital Transformation Across Industries
These trends contributed to QQQ outperforming traditional benchmarks like the S&P 500.
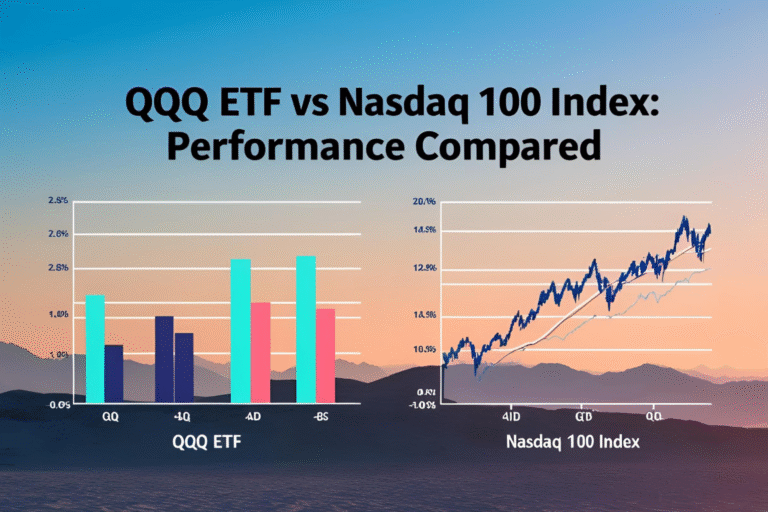
QQQ vs S&P 500 (10-Year Performance)
| ETF | 10-Year Return (Approx.) |
|---|---|
| QQQ | ~380% |
| SPY | ~210% |
QQQ significantly outpaced the broader S&P 500 index, especially during bull markets led by technology stocks.
Notable Events on the 10-Year Chart
- 2018 Correction – Triggered by Fed rate hikes and trade tensions
- 2020 COVID Crash & Recovery – Sharp 30% drop, rapid tech-led rebound
- 2022 Tech Sell-off – Higher interest rates and inflation fears
- 2023 Recovery & AI Rally – Led by Nvidia, Microsoft, and Meta
Each of these events created buying opportunities for long-term investors.
Compounding Returns: The Long-Term Advantage
A $10,000 investment in QQQ made in 2015 would be worth approximately $48,000+ by 2025, assuming dividends are reinvested. This makes QQQ one of the best-performing ETFs of the decade.
Should You Rely Solely on Past Performance?
While the historical QQQ price performance is impressive, it doesn’t guarantee future results. Investors should also consider:
- Valuation levels
- Market cycles
- Sector rotation
- Global economic trends
However, history does suggest that buy-and-hold strategies have worked well with QQQ over the long run.
Final Thoughts
The 10-year historical QQQ price performance shows the ETF’s strong track record, particularly in tech-dominated bull markets. For growth-focused investors, QQQ has consistently rewarded patience and long-term conviction.
FAQs
How much has QQQ returned in the past 10 years?
Approximately 380%, depending on market fluctuations and reinvested dividends.
Is QQQ good for long-term investing?
Yes, its track record shows strong growth, especially for tech-focused portfolios.
When did QQQ have its biggest drop?
During the COVID-19 crash in March 2020, it dropped over 30% before recovering.
Does QQQ outperform the S&P 500?
Historically, yes—QQQ has outperformed the S&P 500 over most 10-year periods.
What sectors drive QQQ’s performance?
Technology, communication services, and consumer discretionary sectors.


